playbook
How to answer “how is hiring going”, and which metrics leadership ignores
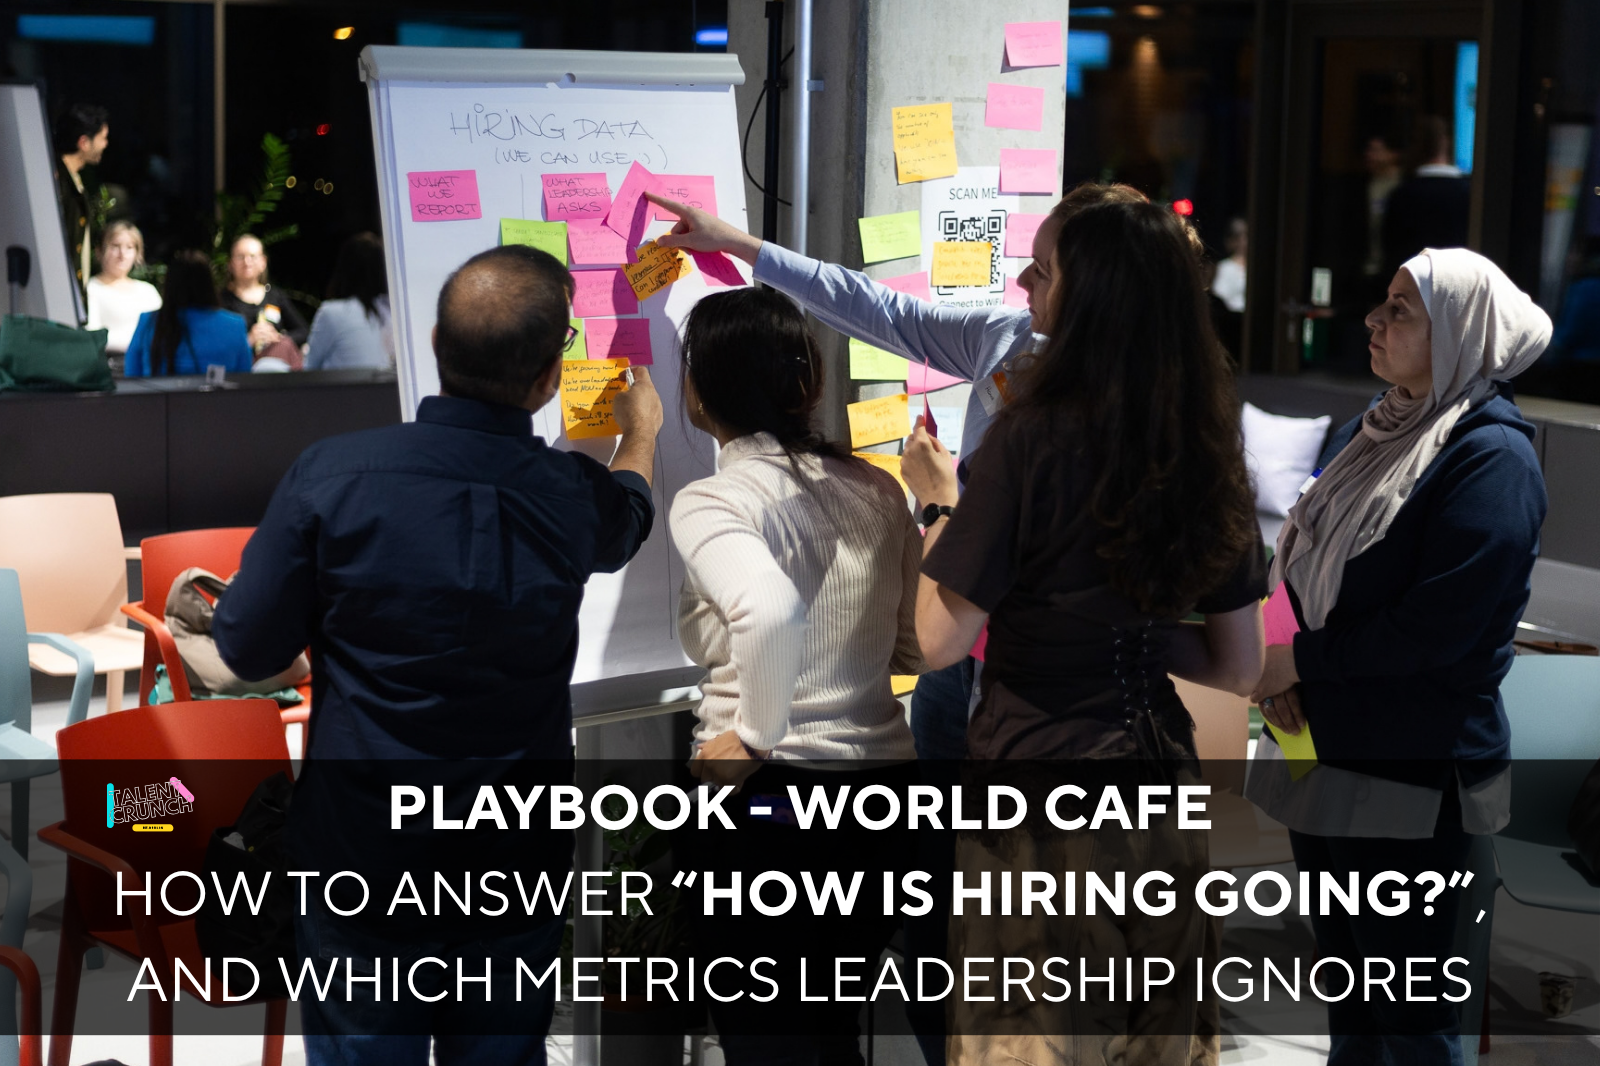
We filled a pillar with roughly thirty metrics from our hiring dashboards. Almost none directly answered the seven questions leadership asks.
By Talent Crunch - Berlin · 2026-09-22
Findings from the hiring data World Café, Talent Crunch and Greenhouse Software, September 2026
We filled a pillar with roughly thirty metrics from our hiring dashboards. The gap column on the flipchart held seven questions leadership asks, and almost none of the thirty answered them directly.

What do talent teams put in a hiring dashboard?
Time to hire, time to fill and offer acceptance rate each appeared four or more times on the wall. Around them sat conversion rates by stage and by source, candidates per stage, days open, interviews per role, time per interview, number of hires per recruiter and per department, diversity of hire, candidate experience, first-interview-to-offer rate, qualified candidates by location and skills, and a traffic light rating for pipeline health.
One post-it recorded the opposite problem: an ATS that shows the number of applicants and nothing else.
What does leadership ask instead?
What we report | What leadership asks | The gap they leave |
|---|---|---|
Speed of hire, time per stage, days open | Will we have the people when we need them? | How close are we to hiring someone, and do we need to change approach? |
Roles filled against roles open, forecast | We are overloaded and need people now. How much will I spend a month? | Are we getting the best talent compared with our competitors? |
Conversion and passthrough by stage | How can we reduce the cost of recruiting? | Are we finding the right candidates for the role? |
Market research, market mapping, sourcing strategy | How are we doing against benchmark, and against which cohort? | Attrition after the hire, and whether the plan holds |
Rejection reasons | What are the actionable points from TA? | Are we reaching revenue, and is there a plan B? |
Are recruiting KPIs the same as business information?
One participant separated the two cleanly: most of what sat on that wall are KPIs we need to manage our own process, which is different from what a leader needs to make a decision. A time to hire of 30 days tells nobody anything on its own. Broken into time in stage, it shows where the delay sits and who owns it.
The same metric also tells different stories depending on who is reading it and what the business is trying to achieve. Hannah Jung of SumUp put the leader's position as a weather question:
How do I interpret the weather right now to know: should I be wearing a bikini or a fur coat?
Is faster hiring better hiring?
One participant described their engineering organisation, where the goal is product velocity and that depends on talent density. Their engineers accept a slower hire to protect the standard, while other parts of the same business optimise for speed. Waiting another month for the right engineer costs less than replacing the wrong one and losing the product impact in between.
Another participant set two weeks as the point where they return to the hiring manager rather than waiting a month, and used interviews per hire against target days to fill to calculate recruiter capacity.
Which numbers does each stakeholder need?
A finance director has no use for time to hire, so the dashboard changes per audience rather than the audience adapting to one dashboard.
One participant framed the CEO's underlying question as attractiveness: how appealing are we in this market, what do we need to pay, what has to change in our employer brand.
They proposed offer rejection rate split by source as the measure, on the basis that an outbound candidate rejecting an offer signals something different from an inbound candidate doing the same.
The session also recorded that talent teams can ask questions back. Alicija's point was that a hiring review works better as a conversation with questions in both directions than as an interrogation.

What external data adds that our ATS cannot
Greenhouse's benchmark report, built from over 640 million applications across more than 6,000 companies, records the following between 2022 and 2025:
Measure | 2022 | 2025 | Change |
|---|---|---|---|
Applications per job | 116 | 244 | +111% |
Recruiters per organisation | 10.43 | 4.62 | -56% |
Monthly hires per recruiter | 2.2 | 4.9 | +122% |
Time to fill | 43.64 days | 59.67 days | +37% |
Numbers like these give a recruiter something their internal dashboard cannot: a comparison. A time to fill of 55 days reads differently once the market average sits near 60.
Five questions for your next hiring review
What decision is this update meant to support, and who is making it?
Which stage is slowest, rather than what the overall time to hire is?
What does this audience control, and which of my metrics touch it?
Are outbound candidates rejecting offers at a higher rate than inbound ones?
Which external benchmark gives my number a comparison?
Frequently asked questions
What is the difference between time to hire and time to fill?
Time to fill counts from opening the role to the offer being accepted, so it includes approval and sourcing time. Time to hire counts from a candidate entering the process to accepting the offer, so it measures the process rather than the delay in front of it.
What recruiting metrics should we report to leadership?
Report the ones tied to the decision in front of them. Time in stage, conversion by source, forecast against plan and offer acceptance carry more for a business audience than a single headline figure.
How do we answer “how is hiring going”?
Answer the question underneath it, which is usually whether the plan is achievable, where the risk sits and what should change. Name the risk and the action, then support both with the numbers.
Is a 30-day time to hire good?
It depends on the role and the goal. Greenhouse's benchmark puts time to fill at 59.67 days in 2025. Where a business needs talent density over speed, a longer process can be the better outcome.
How do we measure employer brand with hiring data?
Split offer rejection rate by source, then compare outbound with inbound. A high rejection rate among candidates we approached points at our attractiveness rather than our process.
Sources
#hiring metrics #recruiting data #leadership #time to hire #benchmarks #world cafe #greenhouse